Under construction....
The Basics
Computing r
There are several formulas to calculate Pearson's r, including:
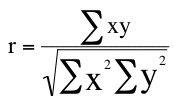
When computing r, the variables must be 2 quantitative variables as the interval or ratio level.
Interpreting r
There are guidelines to interpreting r positive or negative .1-.3 equals to a small strength of association; positive or negative .3-.5 is a medium association; positive or negative .5-1.0 is a large association.
r squared
r squared ranges from 0 to 1 (or 0% to 100%) and tells you the proportion of the total variance that is "explained" by your linear regression model.
.8 * .8 = .64 or 64%
The remained, 36%, is the amount of the unexplained variance.
The total variance is the sum of the explained variance and the unexplained variance.
More Information
13 Ways to look at the correlation coefficient: http://www.stat.berkeley.edu/~rabbee/correlation.pdf
Understanding the Correlation Coefficient https://www.hawaii.edu/powerkills/UC.HTM#S4.3

No comments:
Post a Comment